Many researchers finish a thematic analysis with a spreadsheet: a row for each quote, with columns for its code and its theme. The findings chapter then needs a figure that shows how the themes fit together. Drawing that by hand in a slide or drawing tool takes time, and it has to be redrawn whenever the analysis changes.
Start with a tidy spreadsheet
A figure can only be as clear as the coding behind it. Before drawing anything, check that every quote has one code, every code sits under one theme, and names are spelled the same way every time. A code typed two ways will show up as two codes.
Decide what the figure is for
A thesis figure usually runs the full width of the text. A journal figure often has to fit a single column. A conference slide is wide and is read from the back of a room. Each needs a different amount of detail. One theme with its codes may suit a column, while the full set of themes and connections may suit a slide.
Draw it from the data
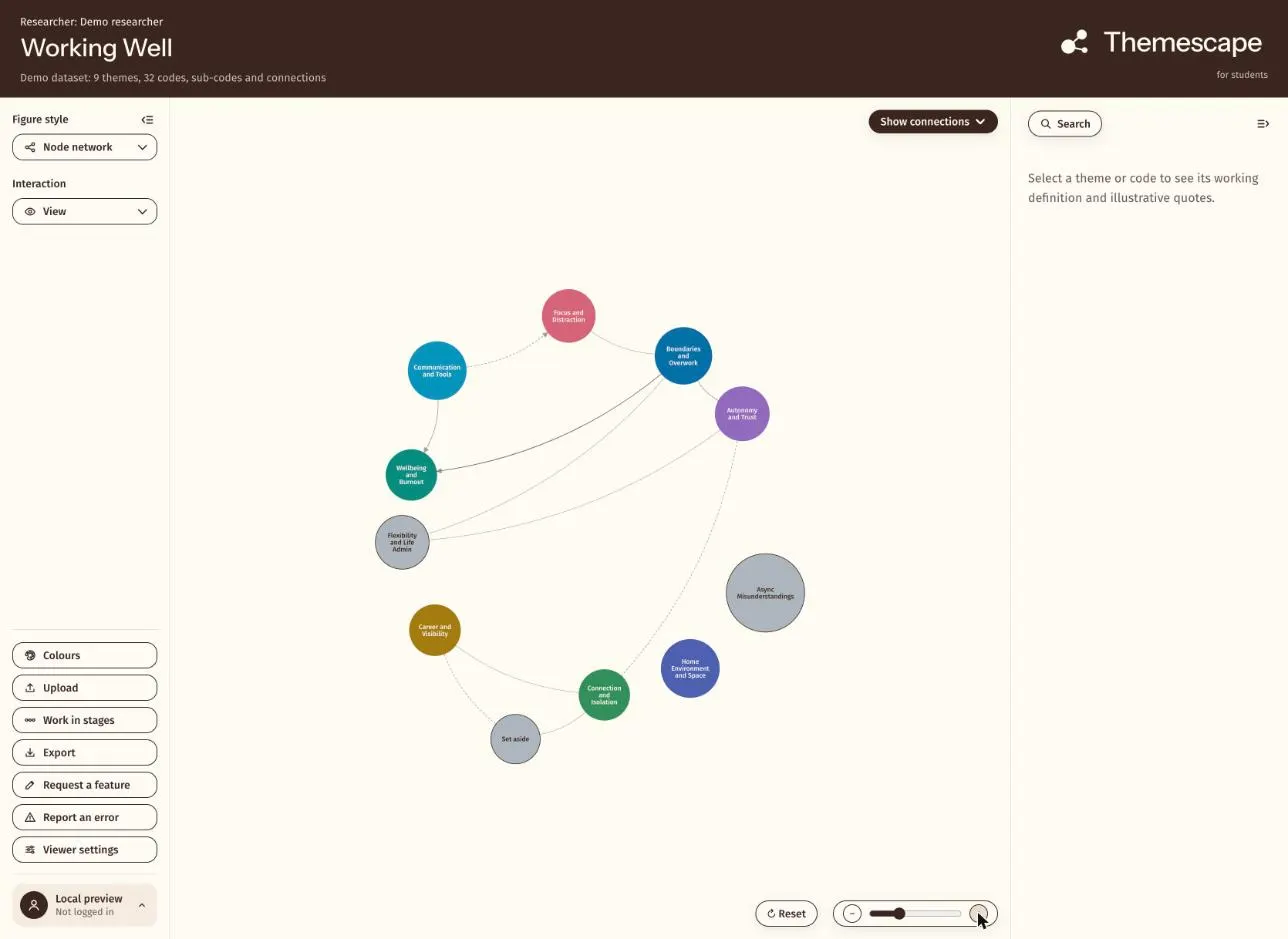
Themescape reads the coded spreadsheet and draws its themes, codes and the links between them as a map. You code in the Themescape spreadsheet template, in Google Sheets or Excel, or bring an existing project across from NVivo, MAXQDA or ATLAS.ti. The viewer then reads the file in your browser.
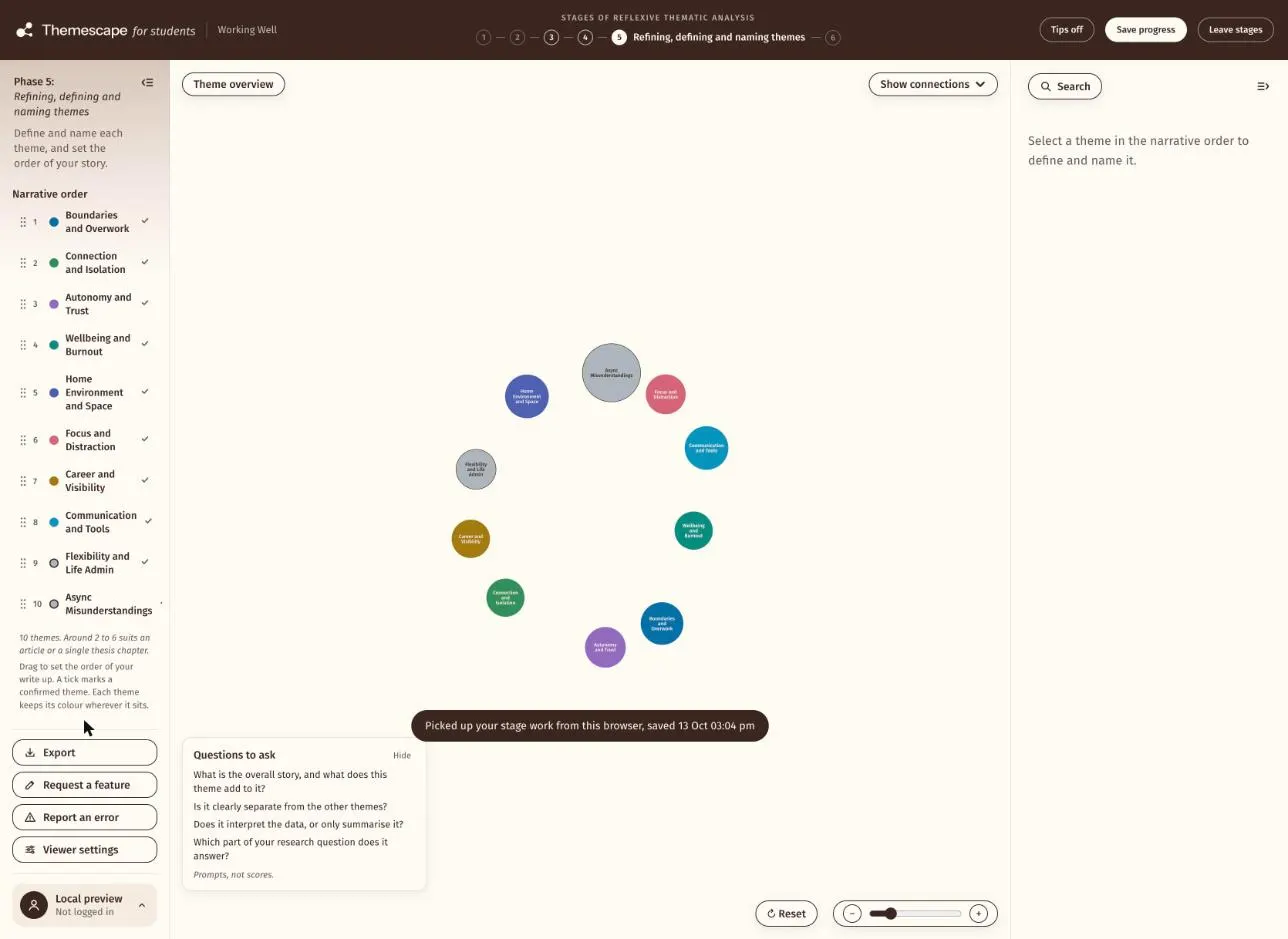
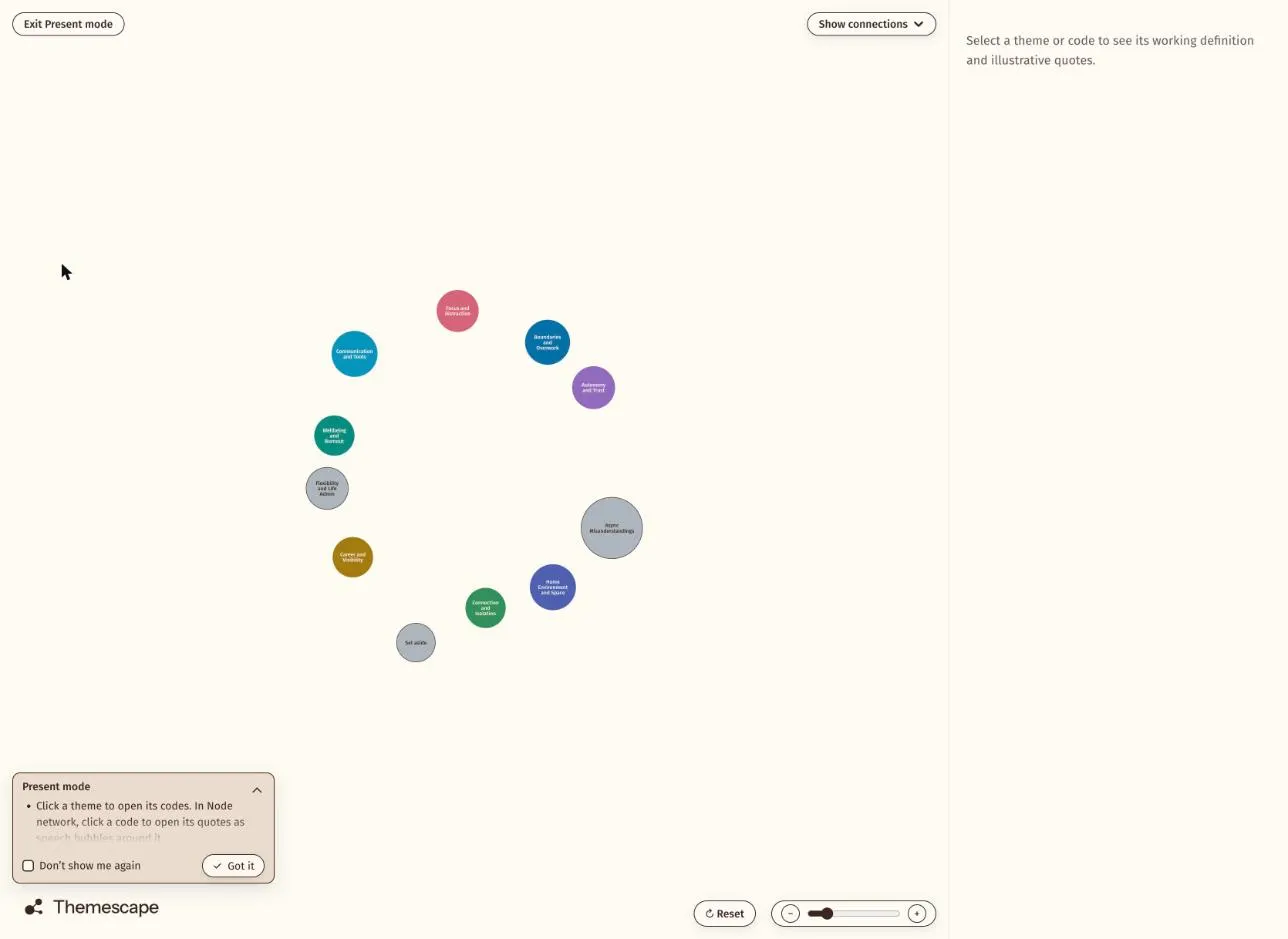
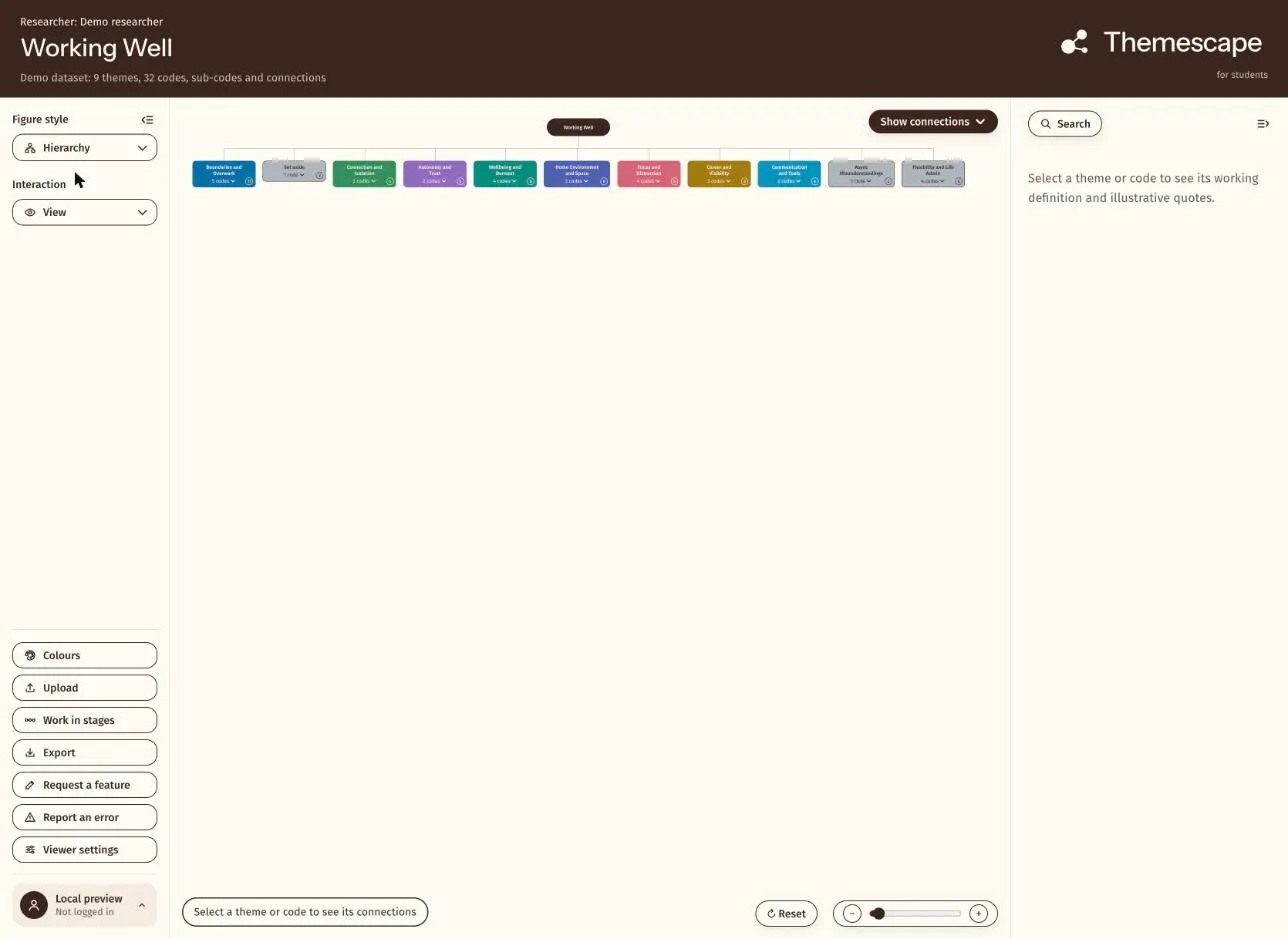
In the viewer you can move between a node network and a hierarchy, refine the themes in Work mode and show them in Present mode. Because the figure is drawn from the spreadsheet, you do not redraw it by hand when the coding changes.
The Themescape site has a figure gallery with examples for a thesis, a journal article and a conference slide, all drawn from sample data.
Keep the data where it belongs
The viewer reads your data in the browser. The host never receives it. That matters when the spreadsheet holds what participants told you in confidence.