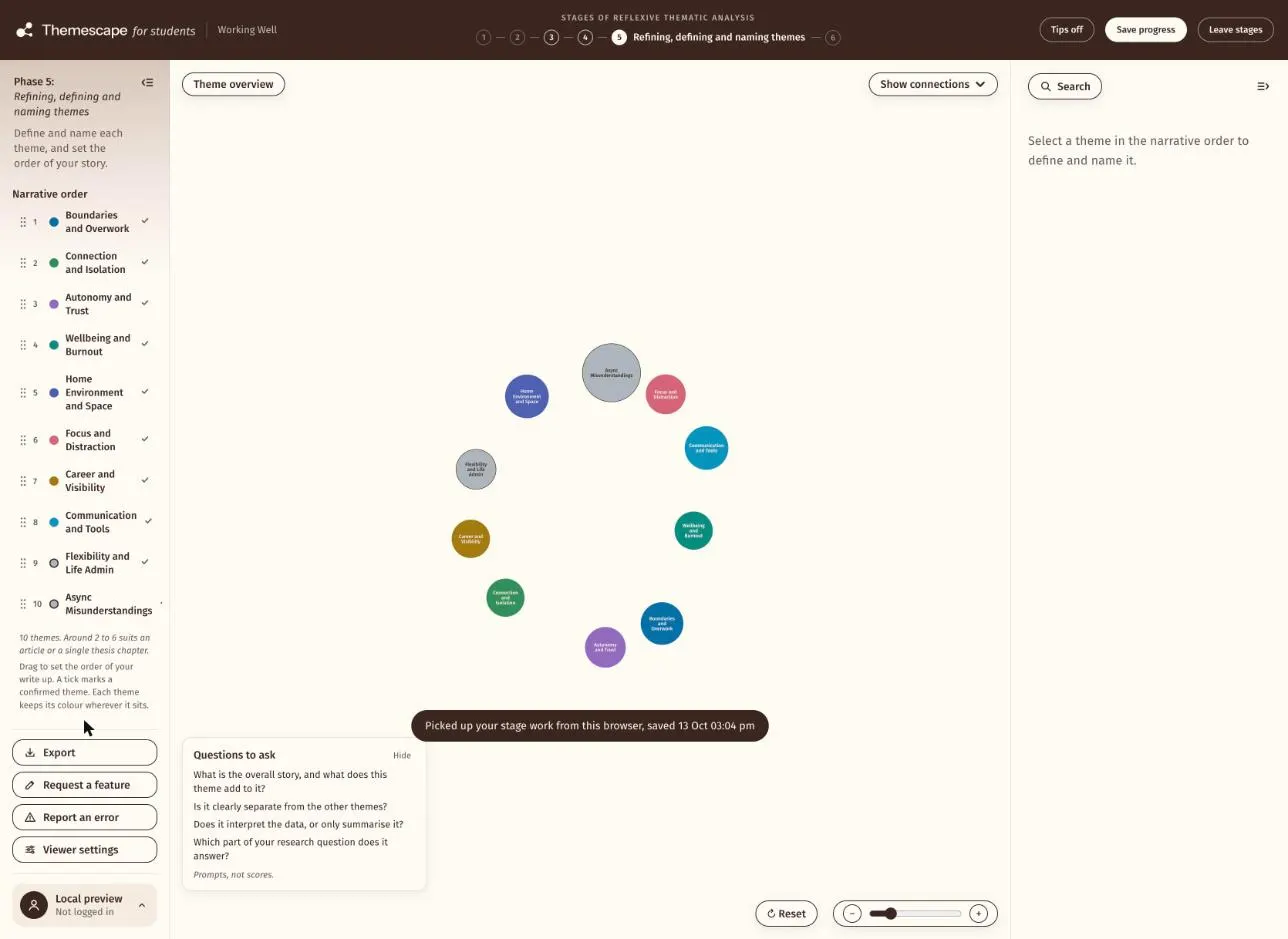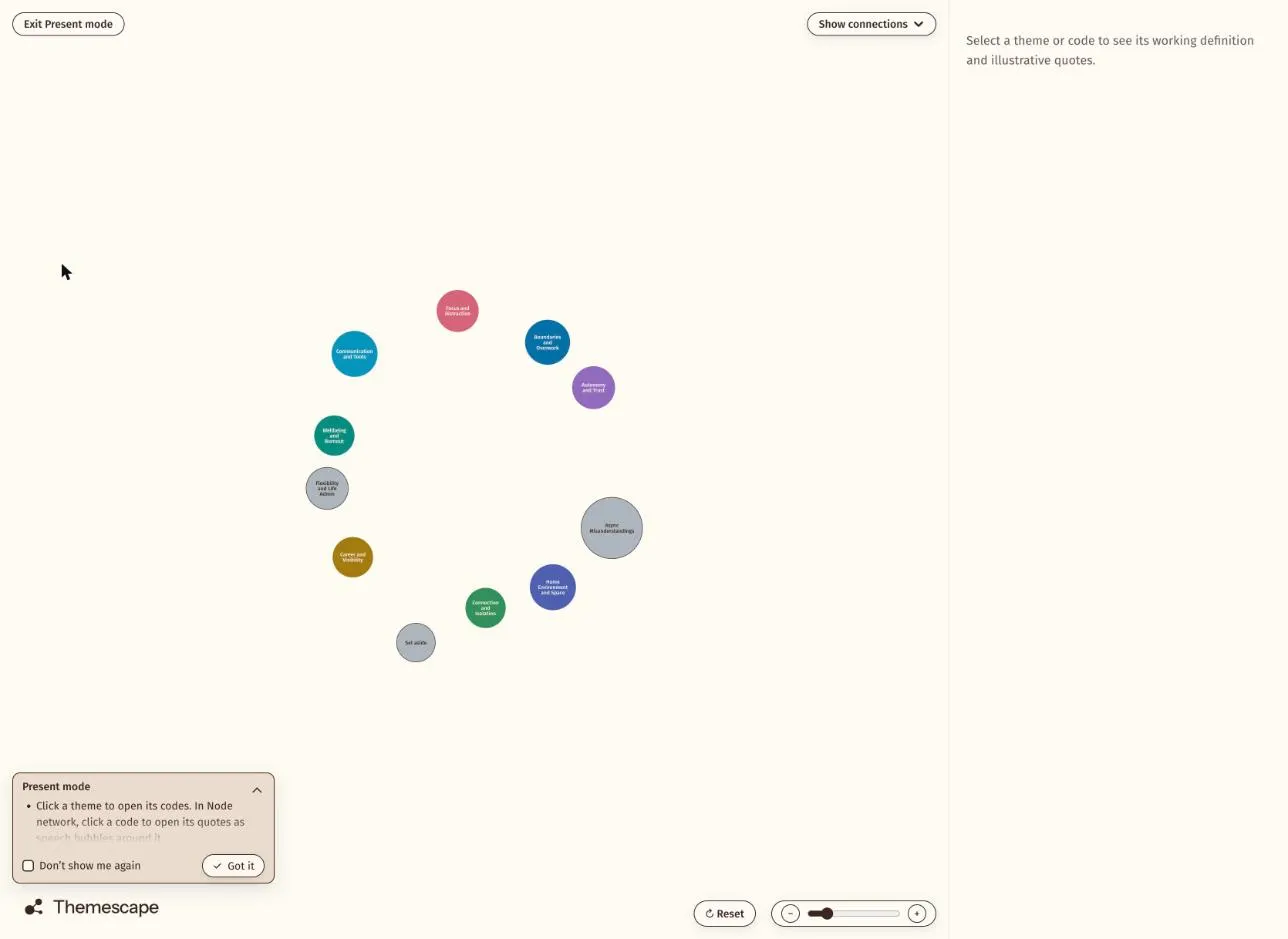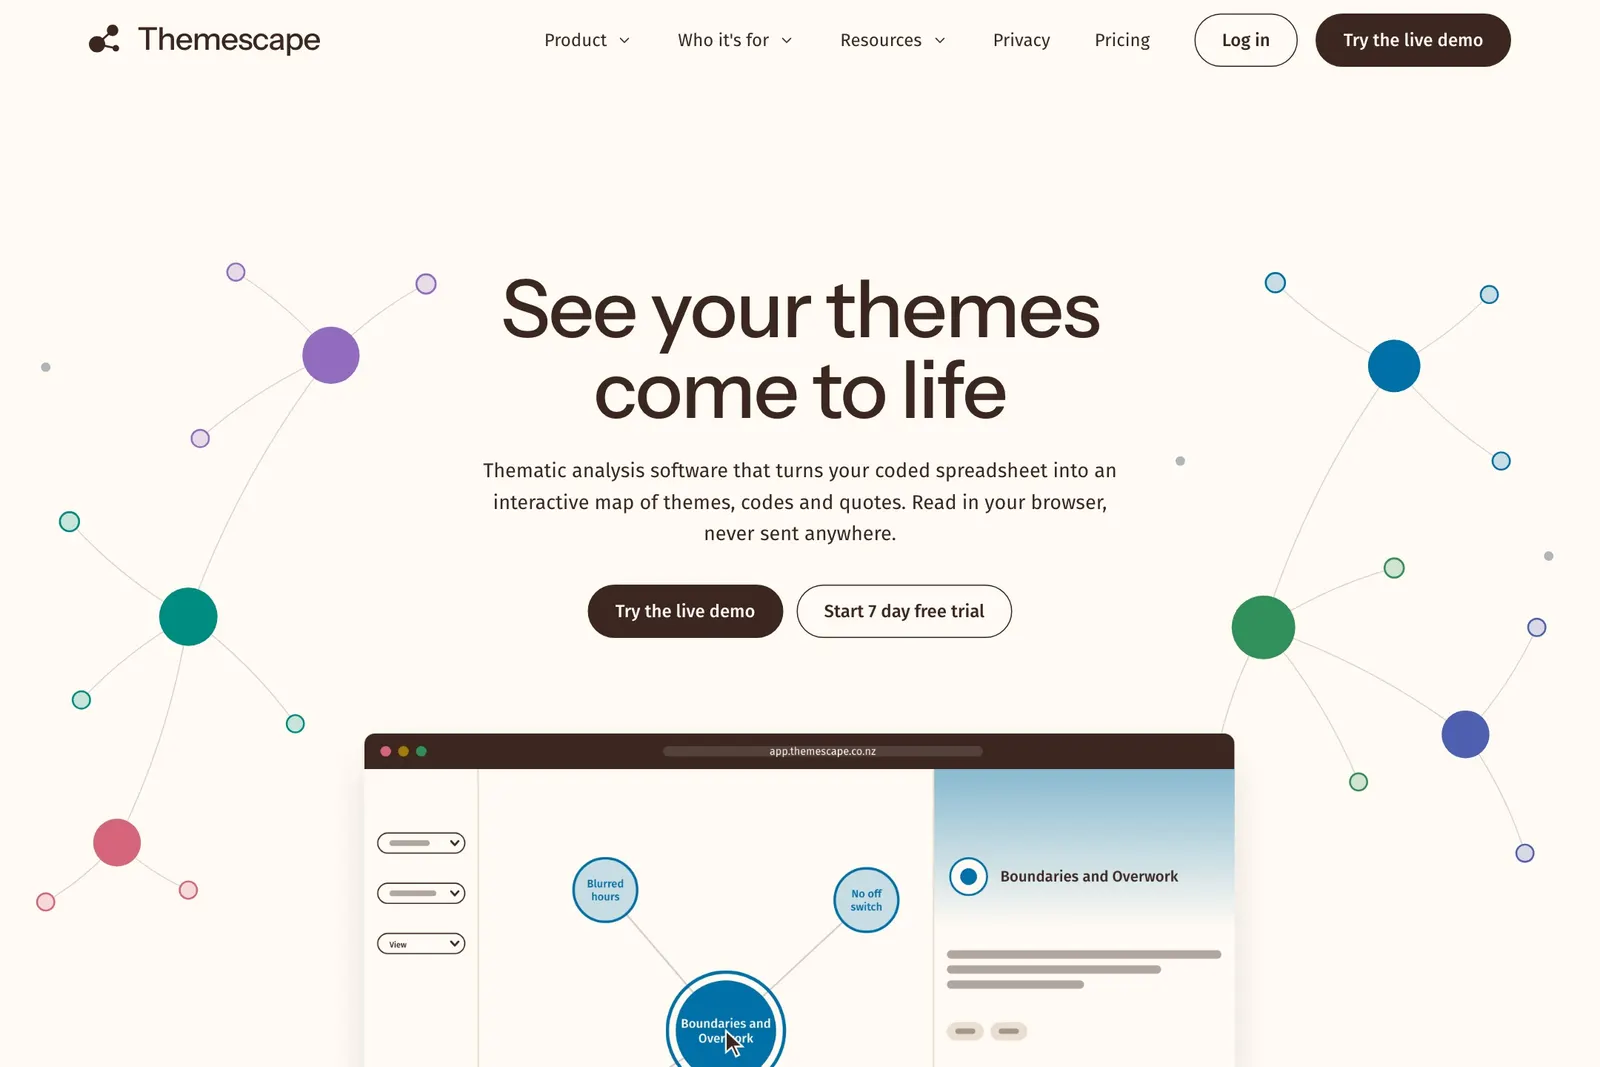
A thematic map is a picture of the findings from a thematic analysis. It shows the themes a researcher has built from their data, the codes that sit under each theme, and how the themes relate to each other.
The parts of a map
A theme is a pattern of meaning that runs through the data. On a map it is usually the largest shape.
A code is a smaller label the researcher gave to pieces of the data while reading it closely. Several codes sit under one theme, joined to it by lines.
A quote is a piece of what a participant said. Quotes are the evidence for a code, and a good map lets you get from a theme down to the words behind it.
A connection is a line between two themes or two codes that the researcher sees as related.
How to read one
Start with the themes. Read their names in turn and you have the outline of the findings. Then pick one theme and look at its codes, which show what the theme is made of. Then read some of the quotes under a code, which show where it came from.
A map is a summary. It does not replace the written analysis, and a theme’s name on its own is not a finding. The map helps a reader hold the whole shape in mind while they read the detail.
Different views of the same analysis
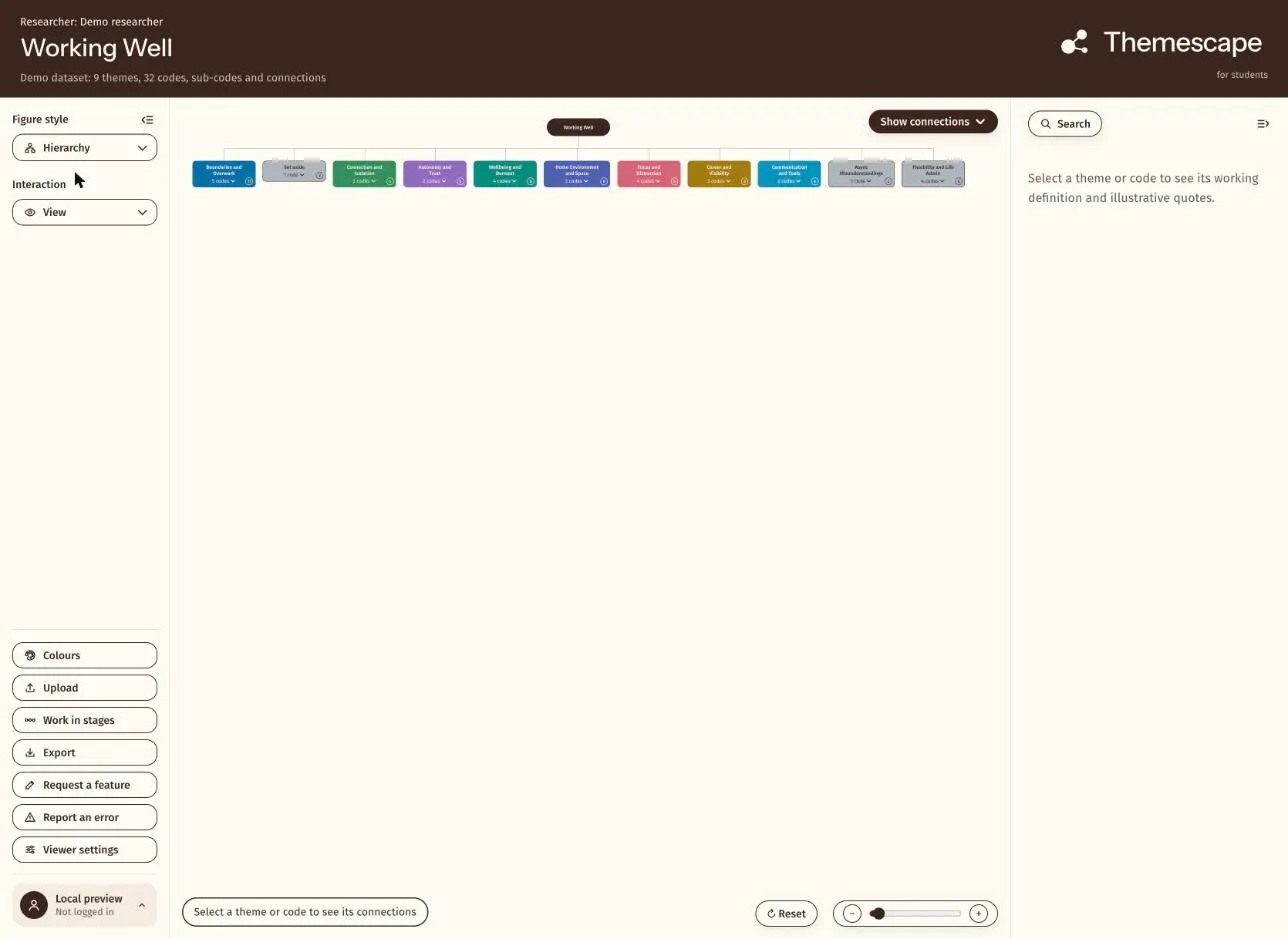
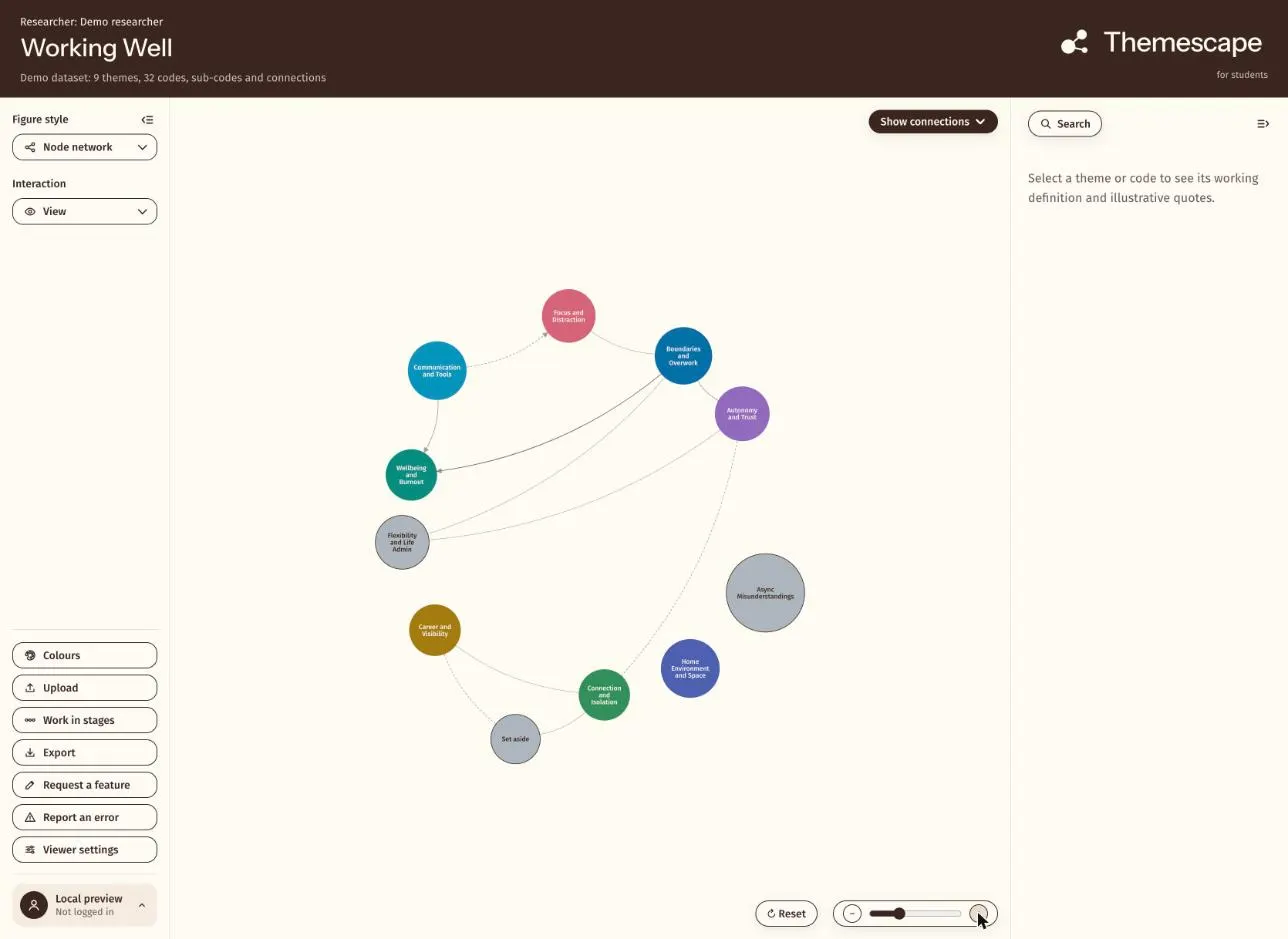
The same analysis can be drawn more than one way. A node network shows themes as circles with their codes around them. A hierarchy shows the levels from theme down to code. Each suits a different job, from working through the analysis to presenting it.
Where Themescape fits
Themescape is a viewer that turns a coded spreadsheet into a map of themes, read in your browser so your research data never leaves your machine. It draws the themes, codes and the links between them as a map you can explore and present. You can try it with a made-up study in the live demo.